The Scientist and Engineer's Guide to
Digital Signal Processing
By Steven W. Smith, Ph.D.
Book Search

Table of contents
- 1: The Breadth and Depth of DSP
- 2: Statistics, Probability and Noise
- 3: ADC and DAC
- 4: DSP Software
- 5: Linear Systems
- 6: Convolution
- 7: Properties of Convolution
- 8: The Discrete Fourier Transform
- 9: Applications of the DFT
- 10: Fourier Transform Properties
- 11: Fourier Transform Pairs
- 12: The Fast Fourier Transform
- 13: Continuous Signal Processing
- 14: Introduction to Digital Filters
- 15: Moving Average Filters
- 16: Windowed-Sinc Filters
- 17: Custom Filters
- 18: FFT Convolution
- 19: Recursive Filters
- 20: Chebyshev Filters
- 21: Filter Comparison
- 22: Audio Processing
- 23: Image Formation & Display
- 24: Linear Image Processing
- 25: Special Imaging Techniques
- 26: Neural Networks (and more!)
- 27: Data Compression
- 28: Digital Signal Processors
- 29: Getting Started with DSPs
- 30: Complex Numbers
- 31: The Complex Fourier Transform
- 32: The Laplace Transform
- 33: The z-Transform
- 34: Explaining Benford's Law
How to order your own hardcover copy
Wouldn't you rather have a bound book instead of 640 loose pages?Your laser printer will thank you!
Order from Amazon.com.
Chapter 25: Special Imaging Techniques
A basic problem in imaging with x-rays (or other penetrating radiation) is that a two-dimensional image is obtained of a three-dimensional object. This means that structures can overlap in the final image, even though they are completely separate in the object. This is particularly troublesome in medical diagnosis where there are many anatomic structures that can interfere with what the physician is trying to see. During the 1930's, this problem was attacked by moving the x-ray source and detector in a coordinated motion during image formation. From the geometry of this motion, a single plane within the patient remains in focus, while structures outside this plane become blurred. This is analogous to a camera being focused on an object at 5 feet, while objects at a distance of 1 and 50 feet are blurry. These related techniques based on motion blurring are now collectively called classical tomography. The word tomography means "a picture of a plane."
In spite of being well developed for more than 50 years, classical tomography is rarely used. This is because it has a significant limitation: the interfering objects are not removed from the image, only blurred. The resulting image quality is usually too poor to be of practical use. The long sought solution was a system that could create an image representing a 2D slice through a 3D object with no interference from other structures in the 3D object.
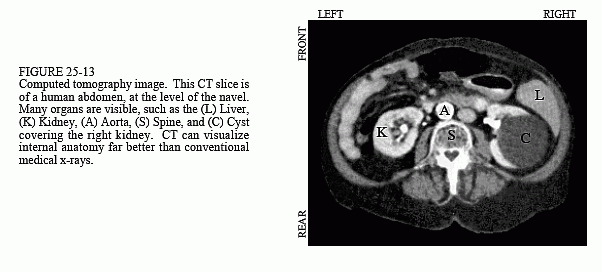
This problem was solved in the early 1970s with the introduction of a technique called computed tomography (CT). CT revolutionized the medical x-ray field with its unprecedented ability to visualize the anatomic structure of the body. Figure 25-13 shows a typical medical CT image. Computed tomography was originally introduced to the marketplace under the names Computed Axial Tomography and CAT scanner. These terms are now frowned upon in the medical field, although you hear them used frequently by the general public.
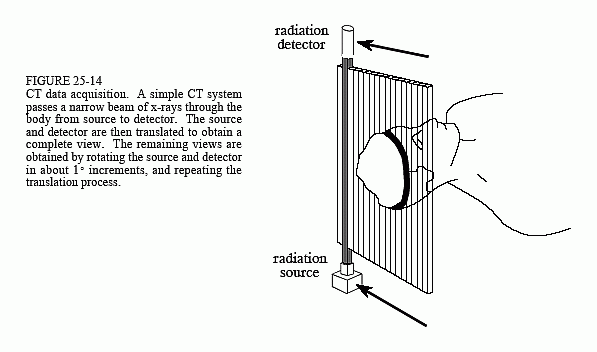
Figure 25-14 illustrates a simple geometry for acquiring a CT slice through the center of the head. A narrow pencil beam of x-rays is passed from the x-ray source to the x-ray detector. This means that the measured value at the detector is related to the total amount of material placed anywhere
along the beam's path. Materials such as bone and teeth block more of the x-rays, resulting in a lower signal compared to soft tissue and fat. As shown in the illustration, the source and detector assemblies are translated to acquire a view (CT jargon) at this particular angle. While this figure shows only a single view being acquired, a complete CT scan requires 300 to 1000 views taken at rotational increments of about 0.3° to 1.0°. This is accomplished by mounting the x-ray source and detector on a rotating gantry that surrounds the patient. A key feature of CT data acquisition is that x-rays pass only through the slice of the body being examined. This is unlike classical tomography where x-rays are passing through structures that you try to suppress in the final image. Computed tomography doesn't allow information from irrelevant locations to even enter the acquired data.
Several preprocessing steps are usually needed before the image reconstruction can take place. For instance, the logarithm must be taken of each x-ray measurement. This is because x-rays decrease in intensity exponentially as they pass through material. Taking the logarithm provides a signal that is linearly related to the characteristics of the material being measured. Other preprocessing steps are used to compensate for the use of polychromatic (more than one energy) x-rays, and multielement detectors (as opposed to the single element shown in Fig. 25-14). While these are a key step in the overall technique, they are not related to the reconstruction algorithms and we won't discuss them further.
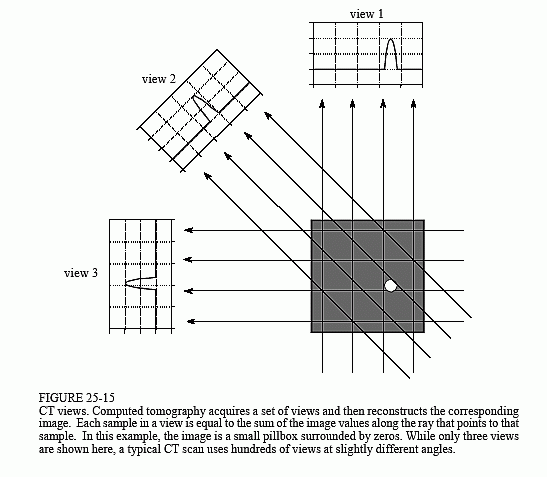
Figure 25-15 illustrates the relationship between the measured views and the corresponding image. Each sample acquired in a CT system is equal to the sum of the image values along a ray pointing to that sample. For example, view 1 is found by adding all the pixels in each row. Likewise, view 3 is found by adding all the pixels in each column. The other views, such as view 2, sum the pixels along rays that are at an angle.
There are four main approaches to calculating the slice image given the set of its views. These are called CT reconstruction algorithms. The first method is totally impractical, but provides a better understanding of the problem. It is based on solving many simultaneous linear equations. One equation can be written for each measurement. That is, a particular sample in a particular profile is the sum of a particular group of pixels in the image. To calculate unknown variables (i.e., the image pixel values), there must be independent equations, and therefore N2 measurements. Most CT scanners acquire about 50% more samples than rigidly required by this analysis. For example, to reconstruct a 512×512 image, a system might take 700 views with 600 samples in each view. By making the problem overdetermined in this manner, the final image has reduced noise and artifacts. The problem with this first method of CT reconstruction is computation time. Solving several hundred thousand simultaneous linear equations is an daunting task.
The second method of CT reconstruction uses iterative techniques to calculate the final image in small steps. There are several variations of this method: the Algebraic Reconstruction Technique (ART), Simultaneous Iterative Reconstruction Technique (SIRT), and Iterative Least Squares Technique (ILST). The difference between these methods is how the successive corrections are made: ray-by-ray, pixel-by-pixel, or simultaneously correcting the entire data set, respectively. As an example of these techniques, we will look at ART.
To start the ART algorithm, all the pixels in the image array are set to some arbitrary value. An iterative procedure is then used to gradually change the image array to correspond to the profiles. An iteration cycle consists of looping through each of the measured data points. For each measured value, the following question is asked: how can the pixel values in the array be changed to make them consistent with this particular measurement? In other words, the measured sample is compared with the
sum of the image pixels along the ray pointing to the sample. If the ray sum is lower than the measured sample, all the pixels along the ray are increased in value. Likewise, if the ray sum is higher than the measured sample, all of the pixel values along the ray are decreased. After the first complete iteration cycle, there will still be an error between the ray sums and the measured values. This is because the changes made for any one measurement disrupts all the previous corrections made. The idea is that the errors become smaller with repeated iterations until the image converges to the proper solution.
Iterative techniques are generally slow, but they are useful when better algorithms are not available. In fact, ART was used in the first commercial medical CT scanner released in 1972, the EMI Mark I. We will revisit iterative techniques in the next chapter on neural networks. Development of the third and forth methods have almost entirely replaced iterative techniques in commercial CT products.
The last two reconstruction algorithms are based on formal mathematical solutions to the problem. These are elegant examples of DSP. The third method is called filtered backprojection. It is a modification of an older
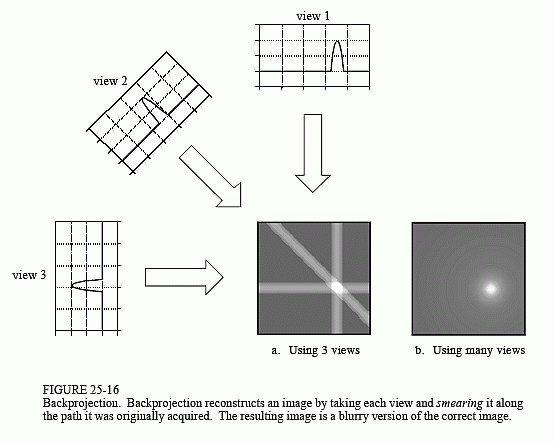
technique, called backprojection or simple backprojection. Figure 25-16 shows that simple backprojection is a common sense approach, but very unsophisticated. An individual sample is backprojected by setting all the image pixels along the ray pointing to the sample to the same value. In less technical terms, a backprojection is formed by smearing each view back through the image in the direction it was originally acquired. The final backprojected image is then taken as the sum of all the backprojected views.
While backprojection is conceptually simple, it does not correctly solve the problem. As shown in (b), a backprojected image is very blurry. A single point in the true image is reconstructed as a circular region that decreases in intensity away from the center. In more formal terms, the point spread function of backprojection is circularly symmetric, and decreases as the reciprocal of its radius.
Filtered backprojection is a technique to correct the blurring encountered in simple backprojection. As illustrated in Fig. 25-17, each view is filtered before the backprojection to counteract the blurring PSF. That is, each of the one-dimensional views is convolved with a one-dimensional filter kernel to create a set of filtered views. These filtered views are then backprojected to provide the reconstructed image, a close approximation to the "correct" image. In fact, the image produced by filtered backprojection is identical
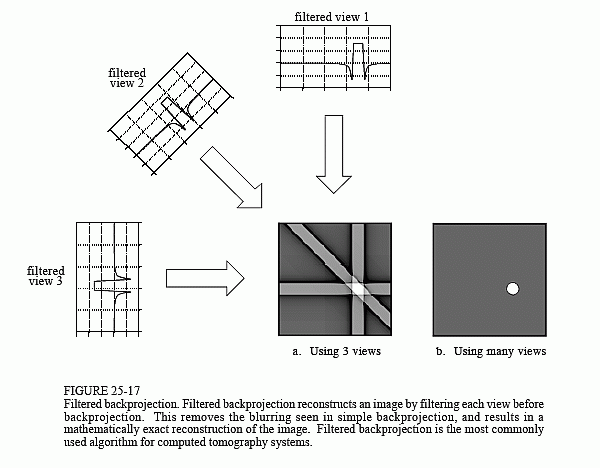
to the "correct" image when there are an infinite number of views and an infinite number of points per view.
The filter kernel used in this technique will be discussed shortly. For now, notice how the profiles have been changed by the filter. The image in this example is a uniform white circle surrounded by a black background (a pillbox). Each of the acquired views has a flat background with a rounded region representing the white circle. Filtering changes the views in two significant ways. First, the top of the pulse is made flat, resulting in the final backprojection creating a uniform signal level within the circle. Second, negative spikes have been introduced at the sides of the pulse. When backprojected, these negative regions counteract the blur.
The fourth method is called Fourier reconstruction. In the spatial domain, CT reconstruction involves the relationship between a two-dimensional image and its set of one-dimensional views. By taking the two-dimensional Fourier transform of the image and the one-dimensional Fourier transform of each of its views, the problem can be examined in the frequency domain. As it turns out, the relationship between an image and its views is far simpler in the frequency domain than in the spatial domain. The frequency domain analysis of this problem is a milestone in CT technology called the Fourier slice theorem.
Figure 25-18 shows how the problem looks in both the spatial and the frequency domains. In the spatial domain, each view is found by integrating the image along rays at a particular angle. In the frequency domain, the image spectrum is represented in this illustration by a two-dimensional grid. The spectrum of each view (a one-dimensional signal) is represented by a dark line superimposed on the grid. As shown by the positioning of the lines on the grid, the Fourier slice theorem states that the spectrum of a view is identical to the values along a line (slice) through the image spectrum. For instance, the spectrum of view 1 is the same as the center column of the image spectrum, and the spectrum of view 3 is the same as the center row of the image spectrum. Notice that the spectrum of each view is positioned on the grid at the same angle that the view was originally acquired. All these frequency spectra include the negative frequencies and are displayed with zero frequency at the center.
Fourier reconstruction of a CT image requires three steps. First, the one-dimensional FFT is taken of each view. Second, these view spectra are used to calculate the two-dimensional frequency spectrum of the image, as outlined by the Fourier slice theorem. Since the view spectra are arranged radially, and the correct image spectrum is arranged rectangularly, an interpolation routine is needed to make the conversion. Third, the inverse FFT is taken of the image spectrum to obtain the reconstructed image.
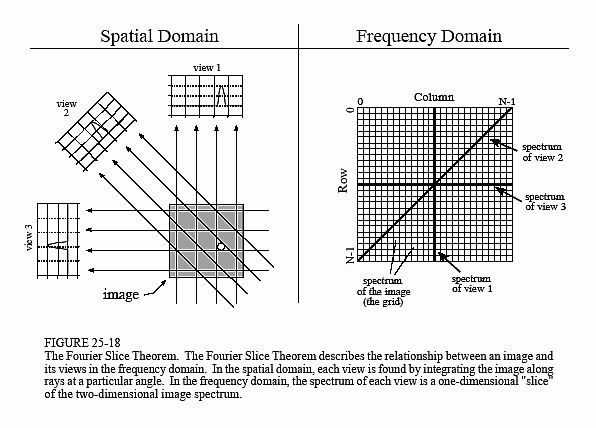
This "radial to rectangular" conversion is also the key for understanding filtered backprojection. The radial arrangement is the spectrum of the backprojected image, while the rectangular grid is the spectrum of the correct image. If we compare one small region of the radial spectrum with the corresponding region of the rectangular grid, we find that the sample values are identical. However, they have a different sample density. The correct spectrum has uniformly spaced points throughout, as shown by the even spacing of the rectangular grid. In comparison, the backprojected spectrum has a higher sample density near the center because of its radial arrangement. In other words, the spokes of a wheel are closer together near the hub. This issue does not affect Fourier reconstruction because the interpolation is from the values of the nearest neighbors, not their density.
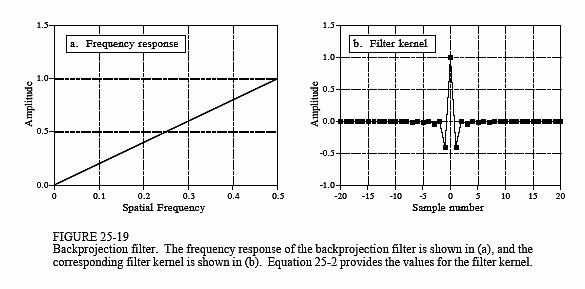
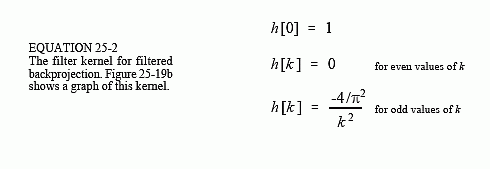
The filter in filtered backprojection cancels this unequal sample density. In particular, the frequency response of the filter must be the inverse of the sample density. Since the backprojected spectrum has a density of 1/f, the appropriate filter has a frequency response of . This frequency response is shown in Fig. 25-19a. The filter kernel is then found by taking the inverse Fourier transform, as shown in (b). Mathematically, the filter kernel is given by:
Before leaving the topic of computed tomography, it should be mentioned that there are several similar imaging techniques in the medical field. All use extensive amounts of DSP. Positron emission tomography (PET) involves injecting the patient with a mildly radioactive compound that emits positrons. Immediately after emission, the positron annihilates with an electron, creating two gamma rays that exit the body in exactly opposite directions. Radiation detectors placed around the patient look for these back-to-back gamma rays, identifying the location of the line that the gamma rays traveled along. Since the point where the gamma rays were created must be somewhere along this line, a reconstruction algorithm similar to computed tomography can be used. This results in an image that looks similar to CT, except that brightness is related to the amount of the radioactive material present at each location. A unique advantage of PET is that the radioactive compounds can be attached to various substances used by the body in some manner, such as glucose. The reconstructed image is then related to the concentration of this biological substance. This allows the imaging of the body's physiology rather than simple anatomy. For example, images can be produced showing which portions of the human brain are involved in various mental tasks.
A more direct competitor to computed tomography is magnetic resonance imaging (MRI), which is now found in most major hospitals. This technique was originally developed under the name nuclear magnetic resonance (NMR). The name change was for public relations when local governments protested the use of anything nuclear in their communities. It was often an impossible task to educate the public that the term nuclear simply referred to the fact that all atoms contain a nucleus. An MRI scan is conducted by placing the patient in the center of a powerful magnet. Radio waves in conjunction with the magnetic field cause selected nuclei in the body to resonate, resulting in the emission of secondary radio waves. These secondary radio waves are digitized and form the data set used in the MRI reconstruction algorithms. The result is a set of images that appear very similar to computed tomography. The advantages of MRI are numerous: good soft tissue discrimination, flexible slice selection, and not using potentially dangerous x-ray radiation. On the negative side, MRI is a more expensive technique than CT, and poor for imaging bones and other hard tissues. CT and MRI will be the mainstays of medical imaging for many years to come.