The Scientist and Engineer's Guide to
Digital Signal Processing
By Steven W. Smith, Ph.D.
Book Search
Table of contents
- 1: The Breadth and Depth of DSP
- 2: Statistics, Probability and Noise
- 3: ADC and DAC
- 4: DSP Software
- 5: Linear Systems
- 6: Convolution
- 7: Properties of Convolution
- 8: The Discrete Fourier Transform
- 9: Applications of the DFT
- 10: Fourier Transform Properties
- 11: Fourier Transform Pairs
- 12: The Fast Fourier Transform
- 13: Continuous Signal Processing
- 14: Introduction to Digital Filters
- 15: Moving Average Filters
- 16: Windowed-Sinc Filters
- 17: Custom Filters
- 18: FFT Convolution
- 19: Recursive Filters
- 20: Chebyshev Filters
- 21: Filter Comparison
- 22: Audio Processing
- 23: Image Formation & Display
- 24: Linear Image Processing
- 25: Special Imaging Techniques
- 26: Neural Networks (and more!)
- 27: Data Compression
- 28: Digital Signal Processors
- 29: Getting Started with DSPs
- 30: Complex Numbers
- 31: The Complex Fourier Transform
- 32: The Laplace Transform
- 33: The z-Transform
- 34: Explaining Benford's Law
How to order your own hardcover copy
Wouldn't you rather have a bound book instead of 640 loose pages?Your laser printer will thank you!
Order from Amazon.com.
Chapter 25: Special Imaging Techniques
An object is visible in an image because it has a different brightness than its surroundings. That is, the contrast of the object (i.e., the signal) must overcome the image noise. This can be broken into two classes: limitations of the eye, and limitations of the data.
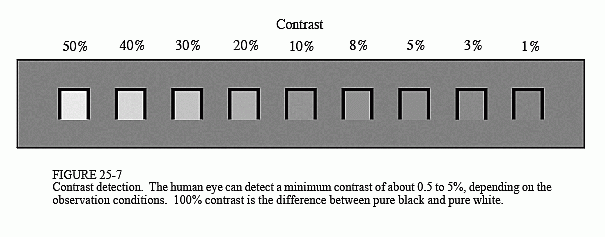
Figure 25-7 illustrates an experiment to measure the eye's ability to detect weak signals. Depending on the observation conditions, the human eye can detect a minimum contrast of 0.5% to 5%. In other words, humans can distinguish about 20 to 200 shades of gray between the blackest black and the whitest white. The exact number depends on a variety of factors, such


as the brightness of the ambient lightning, the distance between the two regions being compared, and how the grayscale image is formed (video monitor, photograph, halftone, etc.).
The grayscale transform of Chapter 23 can be used to boost the contrast of a selected range of pixel values, providing a valuable tool in overcoming the limitations of the human eye. The contrast at one brightness level is increased, at the cost of reducing the contrast at another brightness level. However, this only works when the contrast of the object is not lost in random image noise. This is a more serious situation; the signal does not contain enough information to reveal the object, regardless of the performance of the eye.
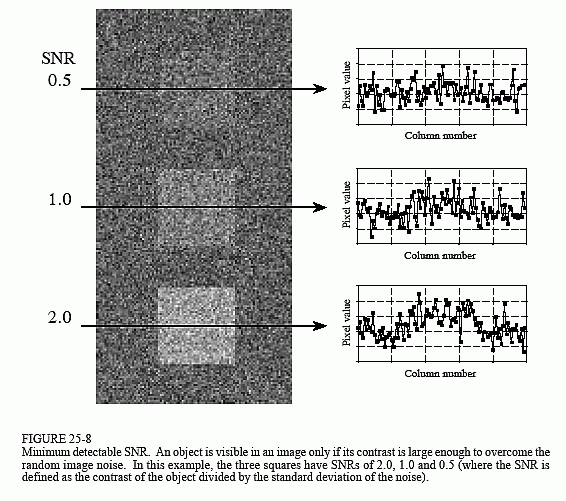
Figure 25-8 shows an image with three squares having contrasts of 5%, 10%, and 20%. The background contains normally distributed random noise with a standard deviation of about 10% contrast. The SNR is defined as the contrast divided by the standard deviation of the noise, resulting in the three squares having SNRs of 0.5, 1.0 and 2.0. In general, trouble begins when the SNR falls below about 1.0.
The exact value for the minimum detectable SNR depends on the size of the object; the larger the object, the easier it is to detect. To understand this, imagine smoothing the image in Fig. 25-8 with a 3×3 square filter kernel. This leaves the contrast the same, but reduces the noise by a factor of three (i.e., the square root of the number of pixels in the kernel). Since the SNR is tripled, lower contrast objects can be seen. To see fainter objects, the filter kernel can be made even larger. For example, a 5×5 kernel improves the SNR by a factor of √25. This strategy can be continued until the filter kernel is equal to the size of the object being detected. This means the ability to detect an object is proportional to the square-root of its area. If an object's diameter is doubled, it can be detected in twice as much noise.
Visual processing in the brain behaves in much the same way, smoothing the viewed image with various size filter kernels in an attempt to recognize low contrast objects. The three profiles in Fig. 25-8 illustrate just how good humans are at detecting objects in noisy environments. Even though the objects can hardly be identified in the profiles, they are obvious in the image. To really appreciate the capabilities of the human visual system, try writing algorithms that operate in this low SNR environment. You'll be humbled by what your brain can do, but your code can't!
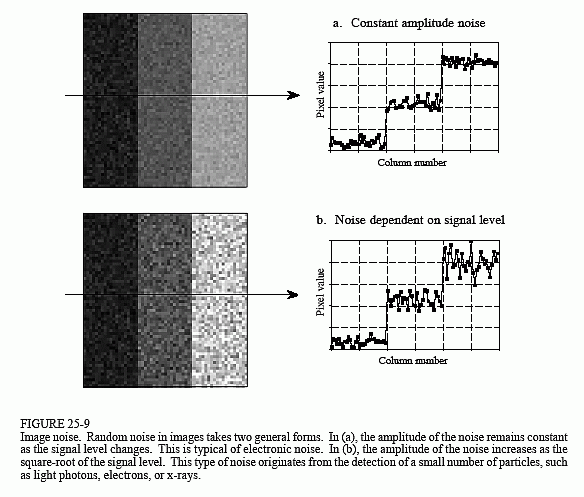
Random image noise comes in two common forms. The first type, shown in Fig. 25-9a, has a constant amplitude. In other words, dark and light regions in the image are equally noisy. In comparison, (b) illustrates noise that increases with the signal level, resulting in the bright areas being more noisy than the dark ones. Both sources of noise are present in most images, but one or the other is usually dominant. For example, it is common for the noise to decrease as the signal level is decreased, until a plateau of constant amplitude noise is reached.
A common source of constant amplitude noise is the video preamplifier. All analog electronic circuits produce noise. However, it does the most harm where the signal being amplified is at its smallest, right at the CCD or other imaging sensor. Preamplifier noise originates from the random motion of electrons in the transistors. This makes the noise level depend on how the electronics are designed, but not on the level of the signal being amplified. For example, a typical CCD camera will have an SNR of about 300 to 1000 (40 to 60 dB), defined as the full scale signal level divided by the standard deviation of the constant amplitude noise.
Noise that increases with the signal level results when the image has been represented by a small number of individual particles. For example, this might be the x-rays passing through a patient, the light photons entering a camera, or the electrons in the well of a CCD. The mathematics governing these variations are called counting statistics or Poisson statistics. Suppose that the face of a CCD is uniformly illuminated such that an average of 10,000 electrons are generated in each well. By sheer chance, some wells will have more electrons, while some will have less. To be more exact, the number of electrons will be normally distributed with a mean of 10,000, with some standard deviation that describes how much variation there is from

well-to-well. A key feature of Poisson statistics is that the standard deviation is equal to the square-root of the number of individual particles. That is, if there are N particles in each pixel, the mean is equal to N and the standard deviation is equal to √N. This makes the signal-to-noise ratio equal to N/√N, or simply, √N. In equation form:

In the CCD example, the standard deviation is √10,000 = 100. Likewise the signal-to-noise ratio is also √10,000 = 100. If the average number of electrons per well is increased to one million, both the standard deviation and the SNR increase to 1,000. That is, the noise becomes larger as the signal becomes larger, as shown in Fig. 25-9b. However, the signal is becoming larger faster than the noise, resulting in an overall improvement in the SNR. Don't be confused into thinking that a lower signal will provide less noise and therefore better information. Remember, your goal is not to reduce the noise, but to extract a signal from the noise. This makes the SNR the key parameter.
Many imaging systems operate by converting one particle type to another. For example, consider what happens in a medical x-ray imaging system. Within an x-ray tube, electrons strike a metal target, producing x-rays. After passing through the patient, the x-rays strike a vacuum tube detector known as an image intensifier. Here the x-rays are subsequently converted into light photons, then electrons, and then back to light photons. These light photons enter the camera where they are converted into electrons in the well of a CCD. In each of these intermediate forms, the image is represented by a finite number of particles, resulting in added noise as dictated by Eq. 25-1. The final SNR reflects the combined noise of all stages; however, one stage is usually dominant. This is the stage with the worst SNR because it has the fewest particles. This limiting stage is called the quantum sink.
In night vision systems, the quantum sink is the number of light photons that can be captured by the camera. The darker the night, the noisier the final image. Medical x-ray imaging is a similar example; the quantum sink is the number of x-rays striking the detector. Higher radiation levels provide less noisy images at the expense of more radiation to the patient.
When is the noise from Poisson statistics the primary noise in an image? It is dominant whenever the noise resulting from the quantum sink is greater than the other sources of noise in the system, such as from the electronics. For example, consider a typical CCD camera with an SNR of 300. That is, the noise from the CCD preamplifier is 1/300th of the full scale signal. An equivalent noise would be produced if the quantum sink of the system contains 90,000 particles per pixel. If the quantum sink has a smaller number of particles, Poisson noise will dominate the system. If the quantum sink has a larger number of particles, the preamplifier noise will be predominant. Accordingly, most CCD's are designed with a full well capacity of 100,000 to 1,000,000 electrons, minimizing the Poisson noise.
