The Scientist and Engineer's Guide to
Digital Signal Processing
By Steven W. Smith, Ph.D.
Book Search
Table of contents
- 1: The Breadth and Depth of DSP
- 2: Statistics, Probability and Noise
- 3: ADC and DAC
- 4: DSP Software
- 5: Linear Systems
- 6: Convolution
- 7: Properties of Convolution
- 8: The Discrete Fourier Transform
- 9: Applications of the DFT
- 10: Fourier Transform Properties
- 11: Fourier Transform Pairs
- 12: The Fast Fourier Transform
- 13: Continuous Signal Processing
- 14: Introduction to Digital Filters
- 15: Moving Average Filters
- 16: Windowed-Sinc Filters
- 17: Custom Filters
- 18: FFT Convolution
- 19: Recursive Filters
- 20: Chebyshev Filters
- 21: Filter Comparison
- 22: Audio Processing
- 23: Image Formation & Display
- 24: Linear Image Processing
- 25: Special Imaging Techniques
- 26: Neural Networks (and more!)
- 27: Data Compression
- 28: Digital Signal Processors
- 29: Getting Started with DSPs
- 30: Complex Numbers
- 31: The Complex Fourier Transform
- 32: The Laplace Transform
- 33: The z-Transform
- 34: Explaining Benford's Law
How to order your own hardcover copy
Wouldn't you rather have a bound book instead of 640 loose pages?Your laser printer will thank you!
Order from Amazon.com.
Chapter 11: Fourier Transform Pairs
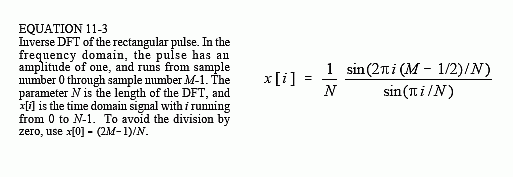
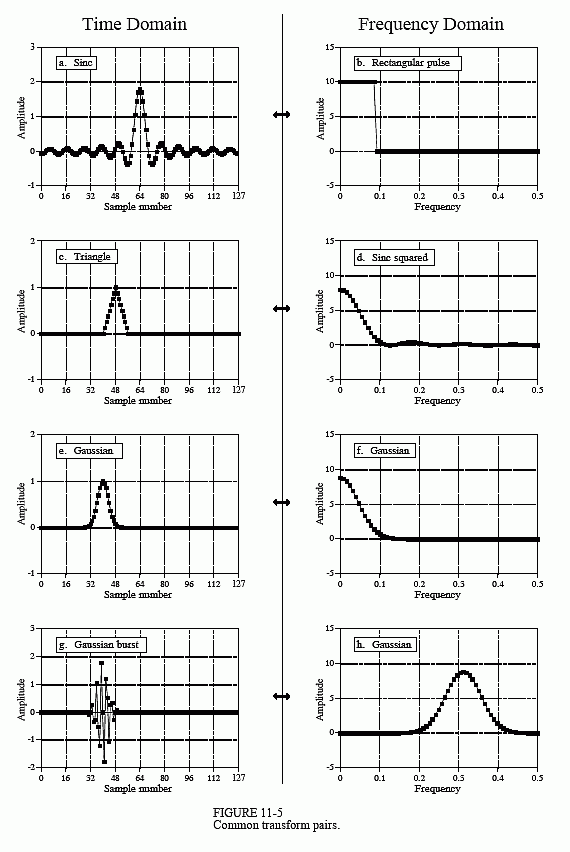
Figure 11-5 (a) and (b) show the duality of the above: a rectangular pulse in the frequency domain corresponds to a sinc function (plus aliasing) in the time domain. Including the effects of aliasing, the time domain signal is given by:

To eliminate the effects of aliasing from this equation, imagine that the frequency domain is so finely sampled that it turns into a continuous curve. This makes the time domain infinitely long with no periodicity. The DTFT is the Fourier transform to use here, resulting in the time domain signal being given by the relation:

This equation is very important in DSP, because the rectangular pulse in the frequency domain is the perfect low-pass filter. Therefore, the sinc function described by this equation is the filter kernel for the perfect low-pass filter. This is the basis for a very useful class of digital filters called the windowed-sinc filters, described in Chapter 15.
Figures (c) & (d) show that a triangular pulse in the time domain coincides with a sinc function squared (plus aliasing) in the frequency domain. This transform pair isn't as important as the reason it is true. A 2M - 1 point triangle in the time domain can be formed by convolving an M point rectangular pulse with itself. Since convolution in the time domain results in multiplication in the frequency domain, convolving a waveform with itself will square the frequency spectrum.
Is there a waveform that is its own Fourier Transform? The answer is yes, and there is only one: the Gaussian. Figure (e) shows a Gaussian curve, and (f) shows the corresponding frequency spectrum, also a Gaussian curve. This relationship is only true if you ignore aliasing. The relationship between the standard deviation of the time domain and frequency domain is given by: 2πσf = 1/σt. While only one side of a Gaussian is shown in (f), the negative frequencies in the spectrum complete the full curve, with the center of symmetry at zero frequency.
Figure (g) shows what can be called a Gaussian burst. It is formed by multiplying a sine wave by a Gaussian. For example, (g) is a sine wave multiplied by the same Gaussian shown in (e). The corresponding frequency domain is a Gaussian centered somewhere other than zero frequency. As before, this transform pair is not as important as the reason it is true. Since the time domain signal is the multiplication of two signals, the frequency domain will be the convolution of the two frequency spectra. The frequency spectrum of the sine wave is a delta function centered at the frequency of the sine wave. The frequency spectrum of a Gaussian is a Gaussian centered at zero frequency. Convolving the two produces a Gaussian centered at the frequency of the sine wave. This should look familiar; it is identical to the procedure of amplitude modulation described in the last chapter.

