The Scientist and Engineer's Guide to
Digital Signal Processing
By Steven W. Smith, Ph.D.
Book Search
Table of contents
- 1: The Breadth and Depth of DSP
- 2: Statistics, Probability and Noise
- 3: ADC and DAC
- 4: DSP Software
- 5: Linear Systems
- 6: Convolution
- 7: Properties of Convolution
- 8: The Discrete Fourier Transform
- 9: Applications of the DFT
- 10: Fourier Transform Properties
- 11: Fourier Transform Pairs
- 12: The Fast Fourier Transform
- 13: Continuous Signal Processing
- 14: Introduction to Digital Filters
- 15: Moving Average Filters
- 16: Windowed-Sinc Filters
- 17: Custom Filters
- 18: FFT Convolution
- 19: Recursive Filters
- 20: Chebyshev Filters
- 21: Filter Comparison
- 22: Audio Processing
- 23: Image Formation & Display
- 24: Linear Image Processing
- 25: Special Imaging Techniques
- 26: Neural Networks (and more!)
- 27: Data Compression
- 28: Digital Signal Processors
- 29: Getting Started with DSPs
- 30: Complex Numbers
- 31: The Complex Fourier Transform
- 32: The Laplace Transform
- 33: The z-Transform
- 34: Explaining Benford's Law
How to order your own hardcover copy
Wouldn't you rather have a bound book instead of 640 loose pages?Your laser printer will thank you!
Order from Amazon.com.
Chapter 11: Fourier Transform Pairs
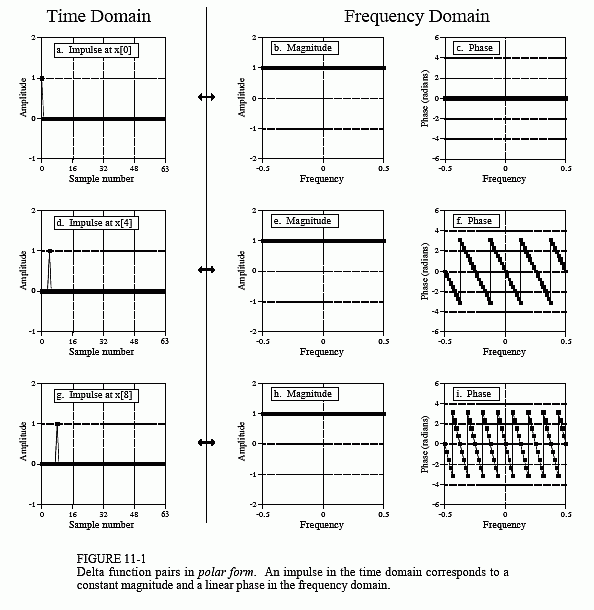
For discrete signals, the delta function is a simple waveform, and has an equally simple Fourier transform pair. Figure 11-1a shows a delta function in the time domain, with its frequency spectrum in (b) and (c). The magnitude is a constant value, while the phase is entirely zero. As discussed in the last chapter, this can be understood by using the expansion/compression property. When the time domain is compressed until it becomes an impulse, the frequency domain is expanded until it becomes a constant value.
In (d) and (g), the time domain waveform is shifted four and eight samples to the right, respectively. As expected from the properties in the last chapter, shifting the time domain waveform does not affect the magnitude, but adds a linear component to the phase. The phase signals in this figure have not been unwrapped, and thus extend only from -π to π. Also notice that the horizontal axes in the frequency domain run from -0.5 to 0.5. That is, they show the negative frequencies in the spectrum, as well as the positive ones. The negative frequencies are redundant information, but they are often included in DSP graphs and you should become accustomed to seeing them.
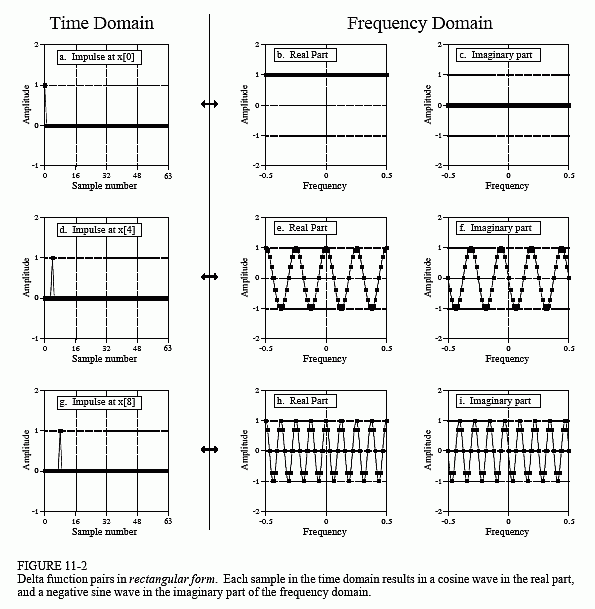
Figure 11-2 presents the same information as Fig. 11-1, but with the frequency domain in rectangular form. There are two lessons to be learned here. First, compare the polar and rectangular representations of the

frequency domains. As is usually the case, the polar form is much easier to understand; the magnitude is nothing more than a constant, while the phase is a straight line. In comparison, the real and imaginary parts are sinusoidal oscillations that are difficult to attach a meaning to.
The second interesting feature in Fig. 11-2 is the duality of the DFT. In the conventional view, each sample in the DFT's frequency domain corresponds to a sinusoid in the time domain. However, the reverse of this is also true, each sample in the time domain corresponds to sinusoids in the frequency domain. Including the negative frequencies in these graphs allows the duality property to be more symmetrical. For instance, Figs. (d), (e), and

(f) show that an impulse at sample number four in the time domain results in four cycles of a cosine wave in the real part of the frequency spectrum, and four cycles of a negative sine wave in the imaginary part. As you recall, an impulse at sample number four in the real part of the frequency spectrum results in four cycles of a cosine wave in the time domain. Likewise, an impulse at sample number four in the imaginary part of the frequency spectrum results in four cycles of a negative sine wave being added to the time domain wave.
As mentioned in Chapter 8, this can be used as another way to calculate the DFT (besides correlating the time domain with sinusoids). Each sample in the time domain results in a cosine wave being added to the real part of the frequency domain, and a negative sine wave being added to the imaginary part. The amplitude of each sinusoid is given by the amplitude of the time domain sample. The frequency of each sinusoid is provided by the sample number of the time domain point. The algorithm involves: (1) stepping through each time domain sample, (2) calculating the sine and cosine waves that correspond to each sample, and (3) adding up all of the contributing sinusoids. The resulting program is nearly identical to the correlation method (Table 8-2), except that the outer and inner loops are exchanged.
