The Scientist and Engineer's Guide to
Digital Signal Processing
By Steven W. Smith, Ph.D.
Book Search
Table of contents
- 1: The Breadth and Depth of DSP
- 2: Statistics, Probability and Noise
- 3: ADC and DAC
- 4: DSP Software
- 5: Linear Systems
- 6: Convolution
- 7: Properties of Convolution
- 8: The Discrete Fourier Transform
- 9: Applications of the DFT
- 10: Fourier Transform Properties
- 11: Fourier Transform Pairs
- 12: The Fast Fourier Transform
- 13: Continuous Signal Processing
- 14: Introduction to Digital Filters
- 15: Moving Average Filters
- 16: Windowed-Sinc Filters
- 17: Custom Filters
- 18: FFT Convolution
- 19: Recursive Filters
- 20: Chebyshev Filters
- 21: Filter Comparison
- 22: Audio Processing
- 23: Image Formation & Display
- 24: Linear Image Processing
- 25: Special Imaging Techniques
- 26: Neural Networks (and more!)
- 27: Data Compression
- 28: Digital Signal Processors
- 29: Getting Started with DSPs
- 30: Complex Numbers
- 31: The Complex Fourier Transform
- 32: The Laplace Transform
- 33: The z-Transform
- 34: Explaining Benford's Law
How to order your own hardcover copy
Wouldn't you rather have a bound book instead of 640 loose pages?Your laser printer will thank you!
Order from Amazon.com.
Chapter 16: Windowed-Sinc Filters
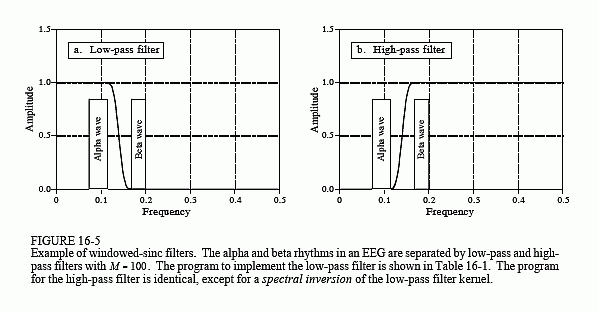
An electroencephalogram, or EEG, is a measurement of the electrical activity of the brain. It can be detected as millivolt level signals appearing on electrodes attached to the surface of the head. Each nerve cell in the brain generates small electrical pulses. The EEG is the combined result of an enormous number of these electrical pulses being generated in a (hopefully) coordinated manner. Although the relationship between thought and this electrical coordination is very poorly understood, different frequencies in the EEG can be identified with specific mental states. If you close your eyes and relax, the predominant EEG pattern will be a slow oscillation between about 7 and 12 hertz. This waveform is called the alpha rhythm, and is associated with contentment and a decreased level of attention. Opening your eyes and looking around causes the EEG to change to the beta rhythm, occurring between about 17 and 20 hertz. Other frequencies and waveforms are seen in children, different depths of sleep, and various brain disorders such as epilepsy.
In this example, we will assume that the EEG signal has been amplified by analog electronics, and then digitized at a sampling rate of 100 samples per second. Acquiring data for 50 seconds produces a signal of 5,000 points. Our goal is to separate the alpha from the beta rhythms. To do this, we will design a digital low-pass filter with a cutoff frequency of 14 hertz, or 0.14


of the sampling rate. The transition bandwidth will be set at 4 hertz, or 0.04 of the sampling rate. From Eq. 16-3, the filter kernel needs to be about 101 points long, and we will arbitrarily choose to use a Hamming window. The program in Table 16-1 shows how the filter is carried out. The frequency response of the filter, obtained by taking the Fourier Transform of the filter kernel, is shown in Fig. 16-5.
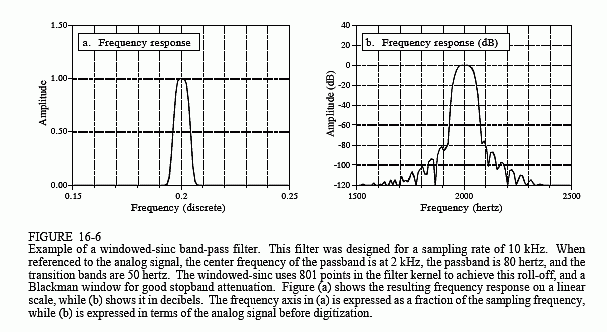
In a second example, we will design a band-pass filter to isolate a signaling tone in an audio signal, such as when a button on a telephone is pressed. We will assume that the signal has been digitized at 10 kHz, and the goal is to isolate an 80 hertz band of frequencies centered on 2 kHz. In terms of the sampling rate, we want to block all frequencies below 0.196 and above 0.204 (corresponding to 1960 hertz and 2040 hertz, respectively). To achieve a transition bandwidth of 50 hertz (0.005 of the sampling rate), we will make the filter kernel 801 points long, and use a Blackman window. Table 16-2 contains a program for calculating the filter kernel, while Fig. 16-6 shows the frequency response. The design involves several steps. First, two low-pass filters are designed, one with a cutoff at 0.196, and the other with a cutoff at 0.204. This second filter is then spectrally inverted, making it a high-pass filter (see Chapter 14, Fig. 14-6). Next, the two filter kernels are added, resulting in a band-reject filter (see Fig. 14-8). Finally, another spectral inversion makes this into the desired band-pass filter.
